Last update: April 19, 2024
Data Analytic with AI — Comparable analysis in Corporate Finance
In the fast-changing world of finance, it’s important to have strong technical skills. But what really shows one’s strength is using those skills to solve real business problems. This article will share how I used my data analytics skills to tackle a common problem in corporate finance: Finding the right companies to compare with each other.
Index

Author: Matt Cheng, DANGER Bootcamp Alumni
In the fast-changing world of finance, it’s important to have strong technical skills. But what really shows one’s strength is using those skills to solve real business problems. This article will share how I used my data analytics skills to tackle a common problem in corporate finance: Finding the right companies to compare with each other.
ABSTRACT
In this project, I tackle the challenge of inconsistent criteria in comparable analysis within the Hong Kong banking sector by developing an AI and machine learning-based solution. This innovative approach employs a Language Model for data extraction and summarisation, vector similarity search for identifying analogous companies, and Tableau for visualising results, thereby enhancing decision-making for buyers and investors.
WHY DID I START THIS PROJECT?
As an investment banking analyst, a major part of my job is creating pitch books for potential IPO candidates, which involves identifying comparable listed companies to project potential IPO earnings.
However, the process of finding comparables is often lengthy and imprecise due to varying judgment criteria across investment banks and regulatory interest in the selection process. For instance, an art trading platform from the PRC seeking comparables in the HK market faced a challenge as there were no direct competitors. Despite this, we were advised to use unrelated companies like “Chow Sang Sang” (00116.hk) and “Prada” (01913.hk) as comparables, here are some actual selected stocks for our research:
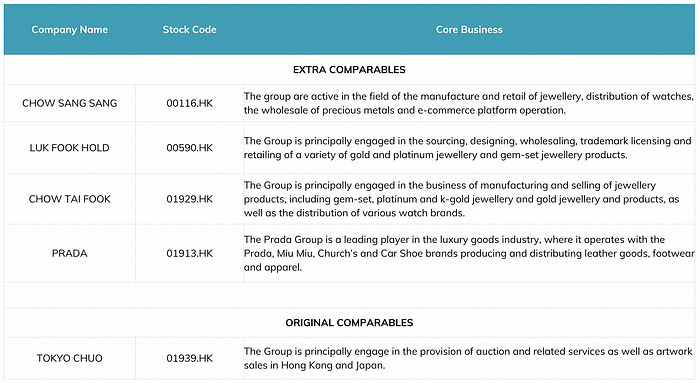
It leads to an unprofessional and unreasonable analysis that took over a week to compile. This experience highlights the need for a more accurate and efficient approach to comparable analysis in the investment banking sector.
This made me wonder if there’s a more efficient and effective way to do this with today’s technology:
Could AI and machine learning help streamline the entire process and make comparable analysis faster without losing accuracy, perhaps in as little as 30 seconds?
ORIGINAL APPROACH
Before we explore the actual workflow, let’s first understand the standard approach. To perform a traditional comparable analysis, we follow four main steps:
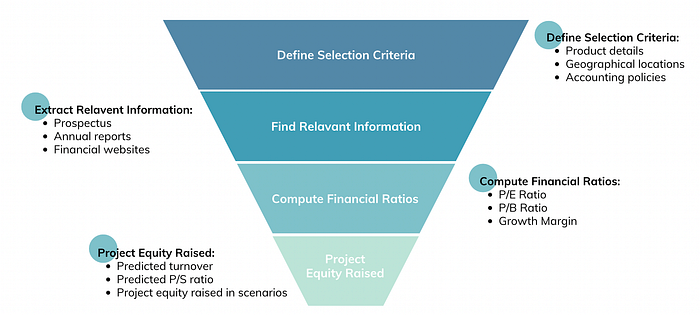
Define Selection Criteria: We start by deciding which factors are most important for comparing companies. Usually, the type of products a company sells is key because it indicates the industry they’re in. Location and, for certain industries like mining, accounting practices can also be important.
Find Relevant Information: We look at annual reports of companies listed on the Hong Kong Stock Exchange (HKEx) and new stock prospectuses to understand their performance and business models. Company websites are also useful for finding additional information.
Compute Financial Ratios: Next, we calculate financial ratios such as profitability, liquidity, and solvency ratios, as well as stock-related ratios like price-to-earnings (P/E) and price-to-book (P/B) ratios. These help us understand the financial health and market position of the companies.
Financial terms explanation:

Project Equity Raised: The final step is to estimate how much equity the company could potentially raise, considering the analysis done in the previous steps, market conditions, and our team’s experience.
HOW DID I EXECUTE THE PROJECT?
To process a large amount of company and financial data for analysis, I designed a workflow using AI and machine learning tools. Here’s a simplified version of the process:
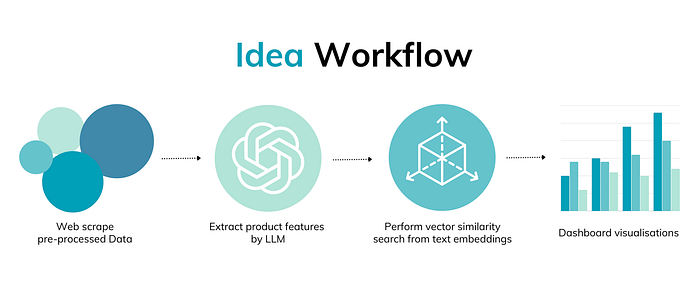
Web Scrape Pre-processed Data: We collect annual reports from the HKEx website and financial data from aastock.com. This is because not all companies have prospectuses available, and some may change their operations after listing.
Extract Product Features by LLM: We apply a Large Language Model (LLM) to extract key information such as product descriptions, segments, and revenue percentages from the collected data. This is done using the OpenAI API to digest and summarise the information.
Vector Similarity Search: To compare companies, we use vector similarity search. This method converts words into numerical values to calculate their similarity. The closer the numerical values, the more similar the companies are.
Dashboard Visualisation: We present our findings in a dashboard for easy visualisation and comparison.
TECHNICAL DETAILS
Below are the exact packages and tools used throughout the entire project:
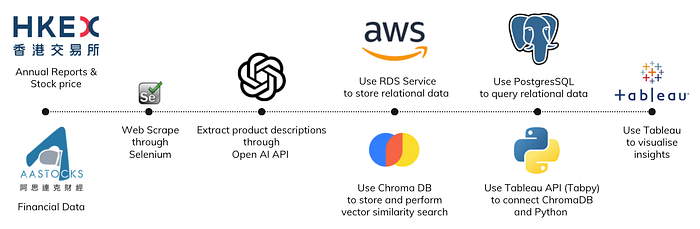
Web-scraping: We use the Selenium package in Python to navigate the dynamic HKEx website.
LLM Processing: To handle PDF annual reports, we first convert them to text using pypdf. Then, we use the Retrieval Augmented Generation (RAG) model to process the texts. This involves converting texts into embeddings with Chroma Vector Database, retrieving relevant pieces, and summarising them with the OpenAI API.
Vector Similarity Search: Information is stored in a vector database like Chroma. When searching for similar companies, we input queries to retrieve the most similar stock codes.
Financial Data Storage: We store financial data in a cloud database like AWS RDS.
Financial Data Retrieval: We manage and retrieve data using PostgreSQL.
Visualisation: We use Tableau for data presentation, connecting it to PostgreSQL and ChromaDB. For real-time vector similarity searches in Tableau, we use the TabPy package to execute Python functions and deliver results.
WHAT IS THE OUTPUT OF THE PROJECT?
The project’s output is presented through a dashboard, which is organised into three main sections:
First Section — Similarity Search Summary

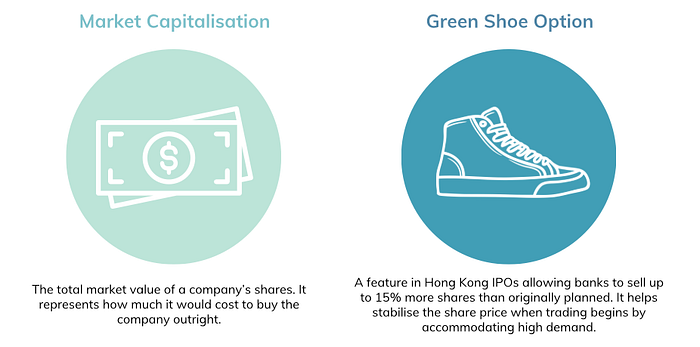
When you enter key phrases, the dashboard calculates and shows the five most similar companies for comparison. It displays basic stock information like Price-to-earnings (P/E) ratio, Price-to-book (P/B) value, and market capitalisation, helping you understand the company’s market value, earnings, and assets compared to its price.
Second Section — Individual Company Descriptions
This section provides a detailed view of each company’s performance over the last five years, including sales trends, gross profit, and net profit. This helps in assessing if a company is a good financial benchmark for comparison.
Third Section — Projected Money Raised

This part estimates how much money a potential client could raise with our investment bank’s help, showing two major figures based on predicted sales and Price/Sales (P/S) ratio, with and without the green shoe option.
Financial terms explanation:
FUTURE ADVANCEMENTS
The current system for extracting features and searching for similar companies works well, but there’s room to make it even better:
Include Website Data: Right now, we only use annual reports and financial numbers. By including data from company websites, we can get the latest updates and use them to improve our analysis.
Consider Accounting Rules: Different industries follow different accounting standards. Paying attention to these rules can make our comparisons more accurate, especially for certain industries like Mining industry.
Vertical Analysis: We’ve been focusing on individual companies. If we also look at their suppliers and customers, including where they are and who they serve, we can make even broader comparisons.
SUMMARY
As Dr. Andrew Ng mentioned in the Stanford University:
AI, as a general purpose technology, creates a lot of new opportunities for everyone. And a lot of exciting and important works that lies ahead of us all is to go and build those concrete use cases.
This project shows how I can use data skills to make business processes better. With more experience and ongoing learning, I’m confident and excited that we can find even more ways to use technology to increase efficiency and solve business problems.